Categories
Uncategorized

Digital Stress and Your Brain

Here are some of the findings in brief:

Our daily consumption of media has more than doubled in the last 50 years from 5 hours to 12 hours.

The average computer user checks 40 websites a day, switching between programs 36 times an hour.

61% of adults admit to being addicted to the internet.

Excessive internet use may lead to the atrophy of grey matter and impact memory, goal-setting, and decision making.

Categories
Uncategorized

Hooray for not being hacked?! LeakedIn. Inspired website name.

Categories
Uncategorized

Which Social Network Has The Highest User Activity?

Categories
Uncategorized

T-Shirt Culture Index

Categories
Uncategorized

Think Global: Act Local. How Big Brands Are Taking Facebook Marketing To The Next Level

Categories
Uncategorized

Social Media Measurement: Planning and Execution

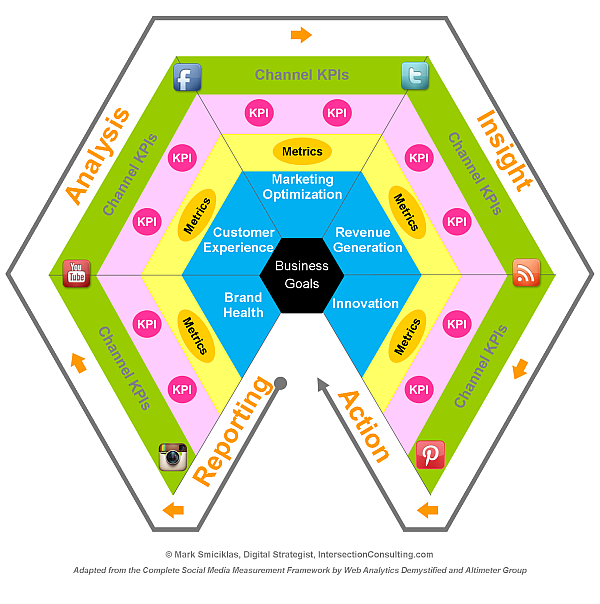
Business Goals – In order for data extracted from a measurement initiative to be useful or effective it needs to connect back to the business objectives of your organization.

These will vary by company and situation – but there are a handful of goals that are universal to most businesses or non profits.

These include optimizing marketing programs, generating revenue , cutting costs, building brand equity and developing new ideas, products or services. For more information about the goals that I’ve included in this model check out the Social Media Measurement Compass in a report about social media analytics by the Altimeter Group.

Metrics – These are the general measurement categories for each objective. For example, under marketing optimization, one common metric would be Awareness.

Key Performance Indicators (KPIs) – For each metric, list relevant performance indicators. For example, for the Awareness metric above one KPI could be Reach.

Channel KPIs – Because each social media channel uses different analytics to measure performance it’s important to identify which unique KPIs will be measured for each platform. Continuing with the example above, channel KPIs for Awareness >> Reach could be as follows:

Facebook – Total reach.
Twitter – Potential reach, effective reach.
Blog – Page views
Youtube – Views

Categories
Uncategorized

Charting the incredible virality of mobile app Draw Something

Draw Something was downloaded 50 million times in 50 days. Users created billions of drawings, adding 3,000 new pictures every second. On March 21st, OMPOP, the company behind the game, was bought up by Zynga for more than $200 million.

The infographic charts the amount of user data, drawings per second, number of servers used to keep the game up and going and the number of users over 8 weeks of the game’s mind-blowing growth. The only question now is, will the game’s addictive nature keep fans or will they get over it as quickly as I have?

Categories
Uncategorized

The explosive growth of the iPad when compared to iPhone and iPod.