via visual.ly


A recap of 100 beautiful slides from the Cannes Lions Festival of Creativity 2012. @jessedee consistently marvels with the design of his presentations.

TED has become notorious across the globe as one of the most innovative conferences of idea distribution. Standing for Technology, Education and Design, TED has opened millions of minds to a different outlook on a number of subjects. With speakers like Malcolm Gladwell, Jamie Oliver and hundreds more – TED has a specific way of cornering the greatest minds on earth. Now, with the TEDx independent conference, TED has been able to spread their brand across hundreds of countries and thousands of cities.

Dan Zarrella, the self titled social media scientist has collected data on more than 1.3 million posts published on the top 10,000 pages to put together this infographic to help you get more likes, comments and shares on your Facebook posts.

6 major companies are dictating about 90% of the media we have access to. In less than 30 years the number of companies providing us with our media has dropped from 50 to just 6. The six companies consisting of GE, New-corp, Disney, Viacom, Time Warner, and CBS. If your wondering who owns the major networks its CBS of course, GE owns NBC, News-corp owns fox, and Disney owns ABC.
42% of Americans are using social media to shop – this equates to nearly 95 million social shoppers in the U.S. – and that number continues to rise. In fact, when asked how often social media is used to shop today versus a year ago, almost 73% of people confirmed they are using it more.
SocialShop – a national quantitative and qualitative research study conducted by Leo Burnett and Arc Worldwide – looks at social media usage from the eyes of a shopper to understand the influence each respective platform has on a person’s buying behavior.
Within SocialShop, Leo Burnett/Arc Worldwide researchers identified six shopper archetypes reflecting the needs and habits of today’s social shoppers. Take a look at the SocialShop infographic below to identify where you fall as a social shopper.


Here are some of the findings in brief:
Our daily consumption of media has more than doubled in the last 50 years from 5 hours to 12 hours.
The average computer user checks 40 websites a day, switching between programs 36 times an hour.
61% of adults admit to being addicted to the internet.
Excessive internet use may lead to the atrophy of grey matter and impact memory, goal-setting, and decision making.


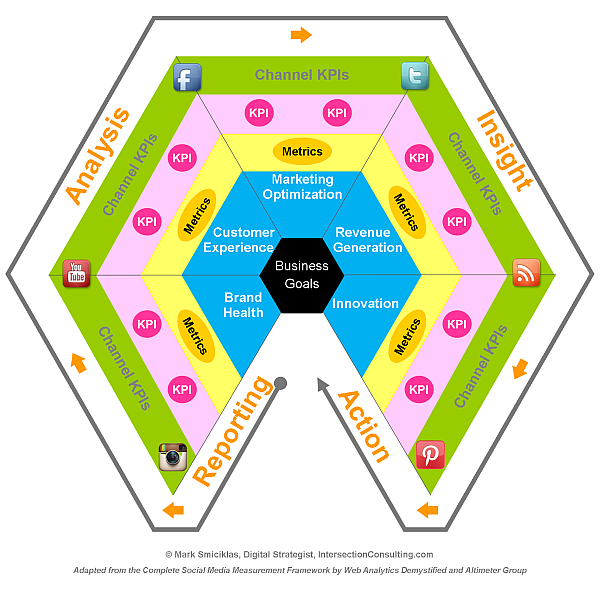
Business Goals – In order for data extracted from a measurement initiative to be useful or effective it needs to connect back to the business objectives of your organization.
These will vary by company and situation – but there are a handful of goals that are universal to most businesses or non profits.
These include optimizing marketing programs, generating revenue , cutting costs, building brand equity and developing new ideas, products or services. For more information about the goals that I’ve included in this model check out the Social Media Measurement Compass in a report about social media analytics by the Altimeter Group.
Metrics – These are the general measurement categories for each objective. For example, under marketing optimization, one common metric would be Awareness.
Key Performance Indicators (KPIs) – For each metric, list relevant performance indicators. For example, for the Awareness metric above one KPI could be Reach.
Channel KPIs – Because each social media channel uses different analytics to measure performance it’s important to identify which unique KPIs will be measured for each platform. Continuing with the example above, channel KPIs for Awareness >> Reach could be as follows:
Facebook – Total reach.
Twitter – Potential reach, effective reach.
Blog – Page views
Youtube – Views

Draw Something was downloaded 50 million times in 50 days. Users created billions of drawings, adding 3,000 new pictures every second. On March 21st, OMPOP, the company behind the game, was bought up by Zynga for more than $200 million.
The infographic charts the amount of user data, drawings per second, number of servers used to keep the game up and going and the number of users over 8 weeks of the game’s mind-blowing growth. The only question now is, will the game’s addictive nature keep fans or will they get over it as quickly as I have?